The A3 method is a tool used to identify problems and propose solutions summarized on just one side of a sheet of paper. It represents a dynamic way of thinking, in which information is organized and synthesized clearly and objectively to achieve the established goal.
The limitations of paper format are a thing of the past, but the method is still widely used. After all, it is not just a template or form: A3 is a Lean tool that encourages simplicity and helps develop systemic thinking for problem-solving.
In this article, we will talk about the origin of the A3 method, the elements that make it up, and how you can create a report of this type in your organization.
How did the A3 method originate?
The A3 method is based on the Toyota production system, also known as Lean Manufacturing. This system focuses on reducing waste and continuous improvement.
In Toyota culture, problems are solved on the factory floor, the Gemba. This Japanese word means “real place” and refers to any place where work happens and value is generated.
Going to the Gemba is crucial to observe, learn, understand problems and guide teams to solutions. The people who work there deal with the processes on a daily basis.
To increase leadership presence at the Gemba, it was requested that all reports be summarized on one page. Since A3 was the largest size of paper that could be faxed, the technique became known as the A3 report or method.
What are the benefits of the A3 methodology?
The A3 method allows your organization to get to the root of a problem, rather than dealing with challenges superficially. After all, it is very common for companies to work with what is called “first-order problem solving.” In other words, seeking an immediate goal, but without considering what caused the challenge.
By not addressing the root cause of the problem, your organization will end up facing the same — or at least similar — challenges in the future. This makes it harder for your operational performance to improve in the long run.
The A3 methodology offers the benefit of helping people engage in a collaborative and in-depth problem-solving process. This is because it encourages project managers to address the real causes of challenges that arise in daily routines.
Since it is a versatile technique, the A3 method can still be used for virtually any situation. A study from Montana State University evaluated the application of the tool in patient transportation within the Community Medical Center. The result was that, after applying the A3 methodology, the time spent transporting patients was reduced by 46%.
What are the facets of an A3 report?
An A3 report is many things at once: from a problem-solving methodology to an alignment tool. Here are the different facets of the A3 methodology:
- Paper size : In its most basic format, A3 is a standardized type of paper that is 297 millimeters wide and 420 millimeters high.
- Template : The A3 can come in the form of a pre-printed template with the steps needed to solve the problem, providing just enough space for the project leader to record their progress.
- Storyboard : This methodology can also be used to track problem-solving or project progress. In this way, the paper becomes a storyboard that facilitates collaboration, communication and coordination among stakeholders.
- Report : Once the problem has been solved, the A3 sheet also serves as a report of the entire initiative. You can write down data collected, hypotheses considered, countermeasures implemented, results of experiments, and corrective actions taken.
- Problem-Solving Methodology : Perhaps the most important use of the A3 method, this facet is found on the left side of the paper. Here, you write about the current condition and the countermeasures that have been explored, tested, and chosen to solve the difficulty faced.
- Management discipline : At higher levels, the A3 method can be a way for leaders and managers to supervise and guide employees. This can be a good opportunity to challenge your team and teach them more about lean manufacturing.
- A3 Analysis : In addition to everything else, A3 is also a process of thinking and reflection. The methodology offers a systematic approach to solving problems or reflecting on work processes.
- Alignment : The final facet of the A3 method comes in the form of an alignment tool. The A3 process provides a standard method for managing and training people. In organizations where the process is more mature, the method is part of the alignment on a given project, with the information laid out for everyone on A3 sheets.

Related Terms – A3 Method
Here are key terminologies that can help you in drafting an A3 report and in your improvement processes:
Lean Manufacturing
A management philosophy derived from the Toyota Production System, focused on eliminating waste and creating value for the customer. Lean Manufacturing seeks continuous process improvement through simplification and optimization of operations.
Read more: Lean processes help create added value and avoid waste
PDCA Cycle
A management framework that structures continuous improvement in four stages: Plan, Do, Check, and Act. The PDCA forms the methodological basis of the A3 report, providing a systematized approach to problem-solving.
Continue reading: What is the PDCA Cycle and How to Use It in Your Quality Management
Gemba
A Japanese term meaning “the real place” where work is performed and value is generated within an organization. The practice of a Gemba Walk involves managers going to the workplace to directly observe processes and identify improvement opportunities.
Kaizen
A Japanese philosophy of continuous improvement through small, incremental, and constant steps. Kaizen aligns with the principles of the A3 method by promoting gradual and sustainable changes that add value to organizational processes.
Root Cause Analysis
A problem-solving method that identifies the fundamental origin of a failure or problem, rather than just treating the symptoms. This technique is essential in the A3 method for implemented countermeasures to definitively eliminate the problem.
Ishikawa Diagram
Also known as a fishbone diagram or cause-and-effect diagram, it’s a graphical tool used in problem analysis. This tool complements the A3 method by helping identify possible causes of a specific problem.
5W2H
An information organization method that answers the questions: What, Why, Where, When, Who, How, and How much. This structure supports the detailing of the action plan in the A3 report, ensuring clarity and completeness.
Continuous Improvement
A management approach that seeks the constant refinement of processes, products, and services through successive cycles of analysis and implementation. Continuous improvement is a fundamental principle of the A3 methodology and quality management.
Learn more: Continuous improvement: the secret to optimizing processes and reducing costs
Visual Management
A technique that uses visual elements to communicate important information quickly and effectively. The A3 method is a visual management tool that condenses complex information onto a single page to facilitate understanding and decision-making.
Process Standardization
The establishment of consistent and replicable methods for performing activities, reducing variability and promoting efficiency. Standardization is a common result of applying the A3 method, ensuring the sustainability of implemented improvements.
Value Stream Mapping
A technique for visualizing the flow of materials and information throughout a process. It helps identify waste and improvement opportunities before filling out the A3 report.
SIPOC
A tool that describes processes in five components: Suppliers, Inputs, Process, Outputs, and Customers. Provides a high-level view to define the scope and boundaries of an A3 project.
5S
A Lean practice for workplace organization in five steps: Seiri, Seiton, Seiso, Seiketsu, and Shitsuke. Ensures a standardized and safe environment, a basis for accurate data collection in the A3.
Kanban
A visual system for controlling workflow through cards and boards. Helps manage tasks and limit work in progress during the implementation of the A3 plan.
Hoshin Kanri
A method for deploying strategic goals throughout the organization, aligning long-term objectives with daily actions. It complements the A3 by connecting improvement initiatives to the company’s strategic directions.
How do you create an A3 report?
A3 follows the PDCA (Plan -Do- Check – Act) concept. It is structured in the following steps:
- Identification;
- Definition and study of the current situation;
- Analysis;
- Proposal;
- Action plan;
- Monitoring of results.
The left side shows the current state, identifying the problem. The right side shows the future state, with possible countermeasures. A3 is read from left to right and top to bottom.
There are several ways to build an A3 report, but they typically include the following parts:
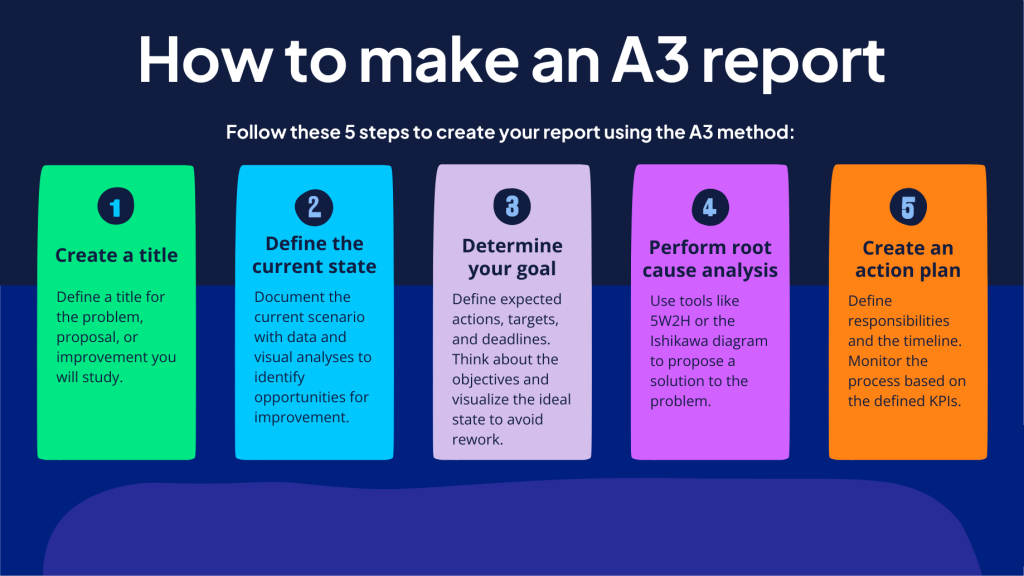
1. Create a title and definition
Define a title for the problem, proposal or improvement to be studied. Then describe what you are trying to solve or analyze, why it is relevant and how it affects the company’s goals.
2. Define the current state
Visualize the context without skimping on effort. Go to the location, talk to those involved and gather all the necessary information about the problem or improvement. Describe what is happening with facts, data or similar experiences.
Identify the location or stage of the process where the problem occurs. Use visual tools to illustrate the current process: Pareto Chart, Histogram, Scatter Diagram, Flowchart, among others.
3. Determine your goal
Define the expected actions, goals and deadlines. According to Lean Manufacturing, think about the objectives and visualize the ideal state to avoid rework and new occurrences of the problem.
Draw a flowchart, picture, or sketch to visualize your desired future state.
4. Perform root cause analysis and propose a solution
Use tools such as 5W2H, cause and effect (Ishikawa) diagram, brainstorming or others available to understand the problem and identify the root cause.
Propose a solution to the problem. With the analyses and goals defined, establish the countermeasures and the course of action for each one.
Show how the proposed actions will resolve the specific causes of the problems or deviations identified in the analysis.
5. Create an action plan and follow through
Define who is responsible for each task within the specific timeline and deadline. Use the 5W2H tool to develop the action plan and the Gantt chart to have a timeline with who is responsible and the actions to be taken.
Finally, monitor the process based on the following parameters:
- Establish indicators or metrics to evaluate the success of the implementation;
- Check the results obtained;
- Standardize what worked;
- Communicate with everyone involved and conduct training to ensure everyone is aware of the change;
- Create standard operating procedures (SOPs) if necessary;
- Take corrective actions in case of deviations;
- Fix what went wrong and restart the PDCA cycle when necessary.

Conclusion
The A3 method stands out as an effective and versatile tool for solving problems within organizations that seek to continuously improve their processes.
By encouraging a structured, visual approach, A3 not only promotes systems thinking, it also enables alignment and collaboration across teams.
Its use goes beyond simple documentation — it is a dynamic process that connects root cause analysis, strategic planning and implementation of countermeasures in a practical and efficient way.
Thus, A3 not only helps solve immediate problems, but also contributes to creating a culture of learning and continuous improvement, essential for the long-term success of any organization.
Looking for more efficiency and compliance in your operations? Our experts can help identify the best strategies for your company with SoftExpert solutions. Contact us today.
FAQ – A3 Methodology
What is the A3 methodology?
The A3 method is a tool used to identify problems and propose solutions, summarized on a single side of a sheet of paper. It’s a Lean tool that promotes simplicity and helps develop systemic thinking for problem-solving; it’s not just a template or form.
How does the A3 methodology work?
The A3 methodology follows the PDCA (Plan-Do-Check-Act) concept and is structured in stages such as identification, definition of the current situation, analysis, proposal, action plan, and results monitoring. The left side of the A3 shows the current state by identifying the problem, while the right side presents the future state with possible countermeasures.
What are the steps of an A3 report?
The steps of an A3 report include: creating a title and defining the problem, defining the current state, determining the desired goal, performing a root cause analysis, and proposing a solution. Then, an action plan with specific responsibilities and deadlines must be created, along with monitoring the process by establishing indicators to evaluate the success of the implementation.
Why is the A3 thinking methodology called that?
The A3 method got its name because it was the largest paper size that could be faxed at the time it was developed at Toyota. As the company requested all reports be synthesized on one page to increase leadership presence in the Gemba (the place where the work happens), the technique became known as the A3 report or method.
Who should use the A3 method?
The A3 method can be used by organizations seeking to continuously improve their processes and solve problems in a structured way. It is especially useful for leaders and managers who want to supervise and guide employees, as well as teams that need to deal with the true cause of challenges that arise in daily routines, promoting a collaborative problem-solving process.